choochoo
Training Diary
2018-11-25
Scaled Heart Rate Impulse - SHRIMP (TRIMP, TSS, …)
I’m writing this article for a couple of reasons.
First, I want to explain and de-mystify the FF-Model (TRIMP, TSS, CTL, ATL, TSB, etc). I get the impression many people don’t understand quite how simple it all is. Following from that, maybe people aren’t understanding exactly what it shows, or how it can or should be used.
Second, I want to showcase Choochoo - a hackable training diary. Choochoo is written for people at the intersection between sport and computing / maths / science. People who want to experiment, get their hands dirty, and build their own, personal, customized approach.
I’m going to show how Choochoo implements the FF-Model. How the calculations are made, what they mean, and how they might be tweaked. I’ll end with some questions that people might want to explore - questions that I hope to explore using this software.
(OK, there’s a third reason. SHRIMP. Cool name, huh?)
Contents
- Theory
- Survey
- This Work
- Discussion
- Appendix - The Author
- [Appendix - An Alternative View]
Theory
Imagine it’s your job to predict how an athlete gets better or worse over time. To model Fitness. What do you do?
You know they get better if they train. And - within reason - the more they train the better they get. So a good first step would be to add up all the training.
But that’s just a number that keeps getting bigger and bigger. You need to take into account that people get worse if they stop training. So why not decrease the number by some fixed amount (10% say) each day they do nothing?
Congratulations! You just invented the FF-Model.
All we need to do now is worry about the details…
Adding Up Training
What, exactly, do we add up?
First, we need to gauge intensity, so we need something you can measure. Power meters are the obvious example. But there are other options, too. Perceived exertion (ranked on a numeric scale - there are various standards) is not as sexy, but could work. Heart rate is another possibility.
Second, we need to decide on a weighting. Harder workouts automatically score more because they are more intense. But maybe they should score extra? Maybe there’s some threshold - no matter how long you do easy work, it just doesn’t count? (These are all valid questions - various approaches have been tried, see Survey below).
Third, we need to measure time. Presumably an hour’s work at a given intensity is “worth” twice as much as 30mins (but this is just an assumption - maybe something we could check later). So we multiply the weighted intensity by time. The final result is called Impulse.
Exponential Decay
How, exactly, do we decrease things over time?
In the simplest case there are two options:
-
We subtract a fixed amount each day (or hour, or whatever) until there’s nothing left.
-
We remove a percentage each day (this is like multiplying by a number smaller than 1 - multiplying by 0.9, say, is the same as subtracting 10%).
The second of these tends to be more common in nature and leads to a common mathematical model called “exponential decay”.
I won’t go into the details, but this is equivalent to having a “half-life” - a time over which the initial value drops to half. We treat fitness like radioactive decay. After some time it will drop to half, then to half of that (to one quarter), etc.
(In practice, instead of half-life we use a related number - “exponential time-scale” which is about 1.4 times as long as the half life. But that’s just a detail from the maths - it’s not important conceptually.)
Fatigue
You may have noticed a problem with our theory so far: it predicts that the person who trains most is the fittest. With no limit. We know that’s not true. People can over-train. People can injure themselves if they push too hard.
How do we include this? We need to measure Fatigue.
To do this we could add up the amount of training they do…. Wait, though. Isn’t that we just said we were going to do for Fitness? What’s the difference? If both Fitness and Fatigue increase when we train then what makes them different?
The difference is that Fatigue is quicker to build and quicker to fall away. That’s easy to include in the model - we’ll scale up the Impulses so it grows more quickly, and we’ll give Fatigue a shorter time-scale, so it falls back more quickly.
We are modeling “being careful”. The idea is to do enough training that Fitness creeps up gradually, but to avoid doing so much that Fatigue gets dangerously high. Train, but keep an eye on Fatigue. If it’s getting too high, take a break.
Summary
For both Fitness and Fatigue:
-
Add up the Impulses from training.
-
Decrease the numbers as time passes.
The difference between the two is that Fatigue is “more noisy” - we add a factor so it grows more quickly when we do train, and tweak the numbers so it decays more quickly when we don’t train.
(By the way, if you hadn’t guessed already, the “FF” in FF-Model stands for Fitness / Fatigue.)
Seriously?
If that seems completely arbitrary, well, yeah. But it works. People dreamt this up and then went away and tested it, and found it does a decent job.
The cynic in me suspects this is partly because people are difficult to experiment on. I discuss this further in Uncertain Science.
Survey
Academic Literature
I can’t access many of the original papers. They are either pre-Internet or behind paywalls. What follows comes from reading the survey section of other papers.
The general model (Impulse + Decay) seems to have been presented first in various(?) papers by Calvert, Banister and others, with titles like “Systems Model …” in the mid 70s. None of these appear to be available online (for free). They are generally referred to as “Banister”.
Originally it seems that the model had three components, but this was later reduced to two (Fatigue and Fitness).
Various ways of calculating the Impulse were suggested, changing to reflect the availability of new technology. This is a good summary that lists:
-
Training Volume. Not really Impulse as I described it, but total miles or hours.
-
Rating of Perceived Exertion (RPE) x Duration. RPE describes “how hard” a workout was on a numeric scale (eg. 0 to 9).
-
Average Heart Rate x Duration.
-
Heart Rate Zone x Duration. Attributed to Edwards.
-
Corrected Heart Rate Reserve x Duration. (Fraction of) Heart Rate Reserve is a measure of Heart Rate which is 0 at rest and 1 at maximum. The heart rate is modified with a correction (depending on sex) intended to give a value that correlates with blood lactose level. This seems to be the “standard” TRIMP score that is mentioned throughout the literature and credited most often to Banister.
With the arrival of power meters, Training Stress Score (TSS) was
introduced by Coogan. This appears to
be
output power, corrected to reflect physiological load (called
Normalized Power, NP), normalized to threshold power (called Intensity
Factor), squared (similar to SHRIMP gamma of 2 - see below) and
multiplied by duration. The idea is to duplicate TRIMP.
Hellard et al. give a somewhat critical review of the FF-Model with an emphasis on the difficulty in fitting and the consequent large uncertainties in parameters.
Popular Literature
Friel, in The Cyclist’s Training Bible gives a clear explanation of Fitness and Fatigue (without getting into any theory at all) in section 3 (Basic Training Concepts) on p34 of the 5th edn. He also implies that Form is something like the difference between the two. This is a useful idea, but perhaps not to be taken literally. The shape you will see when subtracting the two depends on their relative scale. This is the problem Training Peaks have with TSB (see below) and requires that the parameters are fitted to the data.
Software
Training Peaks
Training Peaks describe the FF-Model here. They use TSS as the Impulse and claim extensive supporting evidence (although when using TRIMP).
They note that 50 or more measurements per parameter (four for their Fitness and Fatigue models) are required for good fitting and that Banister implies measuring performance every 4 days. Since this is impractical they use unit scaling for both responses and fix the time periods at 7 (Fatigue / ATL) and 42 (Fitness / CTL) days.
| Variable | Description |
|---|---|
| Chronic Training Load (CTL) | Fitness (with unit scale) |
| Acute Training Load (ATL) | Fatigue (with unit scale) |
| Training Stress Balance (TSB) | CTL - ATL |
[Note: There is a comment in the Training Peaks document that I do not understand. They claim that eliminating the scaling makes the processing significantly easier (replacing moving average with integral sums?)]
The main effect of this unit scaling is that the shape of TSB changes (the minimum of CTL - ATL depends on the relative scaling of the two curves).
Golden Cheetah
As far as I can tell (see here) Golden Cheetah replicates CTL, ATL and TSB from Training Peaks.
Strava
Strava don’t document their calculations in any detail, but it sounds like they’re similar to Training Peaks (although also supporting Heart Rate - based Impulses).
Open Questions
If we look at the FF-Model and current implementations, what problems can we see? Where can we improve things? What can go wrong?
Arbitrary Form
The theory section made clear just how arbitrary the FF-Model is.
How can we make the model more flexible without adding so many parameters it becomes useless? Can we replicate the different historical Impulse models by varying a model parameter?
Parameter Fitting
The model has a bunch of parameters. What values should they have?
Do we need different values for different contexts? Do we need different values for different sports? Or different styles of training?
Should we change training to reflect the need to measure parameters? What kind of measurements should we make?
This Work
Choochoo
Choochoo is a free, hackable training diary, written in Python, that should run on a wide variety of computers. It can import FIT files, process data with user-provided algorithms, and export results to Pandas and Jupyter for further analysis and display.
This work extended Choochoo with:
-
A task to calculate “HR Impulse” values from Heart Rate measurements during exercise.
-
A task to calculate Fitness and Fatigue responses from these Impulses.
-
Support for displaying and analyzing the results.
Fitting of model parameters is currently not supported.
Impulse Calculation
The HR Impulse is calculated in three steps:
-
Each Heart Rate measurement is converted to a HR Zone following the schema used by the British Cycling calculator.
This step transforms arbitrary Heart Rate values onto a scale that has some physiological basis. Zones are relative to FTHR (Functional Threshold Heart Rate). The values are comparable between different people.
The calculated zone is a floating point value, numerically equal to the zone number at the lower end of the zone, and linearly interpolated to the upper end. For example, if zone 3 extended from 130 to 150 bpm a value of 130 would be given a zone of 3.0 and a value of 140 a zone of 3.5.
Values in zone 1 and above zone 5, which are open intervals, are extrapolated as though the zones had the same width as neighboring zones.
-
The zone value is transformed using the expression:
zone' = ((max(zone, zero) - zero) / (5 - zero)) ** gammaThis is shown below (with
zeroset to 0).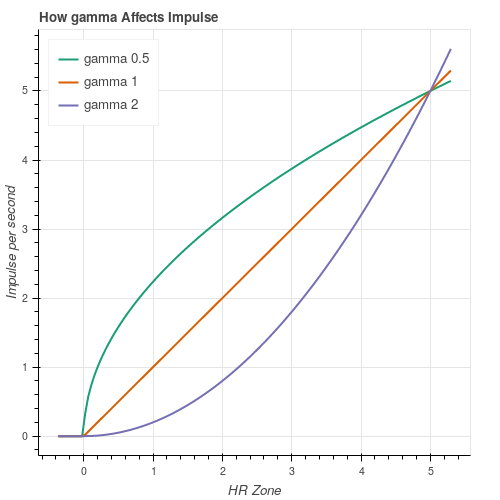
The transformation can be understood in three stages. First, values below a threshold (
zero) are discarded. Next, the range to zone 5 is normalized to the range 0-1. Finally, this normalized value is raised to the powergamma.This “gamma correction” is a standard technique for parameterizing uncertainty in the shape of a function. A value of
gammagreater than 1 will give a “concave” curve - in this case implying that high zones are significantly more important than low zones. A value ofgammaless than 1 will give a “convex” curve - implying that low zones are similar in importance to high zones.This step accommodates different ideas about how the body responds to exercise - whether all levels of exertion should be weighted similarly, or whether harder efforts are “worth more” in some way.
For example, if we believe that only intensive exertion is effective, we can raise
zeroto 3 or 4. And if we feel that all exertion above that point should be weighted roughly equally then we can lowergammato, say, 0.1, giving a curve that approximates a “top hat” response.By default, the
gammaparameter is set to 2 andzeroto 0. -
The impulse is calculated as:
impulse = zone' * delta_twhere
delta_tis the time (in seconds) between this measurement and the next. In a typical FIT filedelta_tis around 10s; if it exceeds a configurable cutoff (max_secs, default 60s) then no impulse is calculated. This avoids calculating incorrect, high impulses when the data feed drops.This step takes account of how much time was spent on training at a particular level of exercise. As discussed earlier, we assume that more time means more gains.
Other Impulse Models
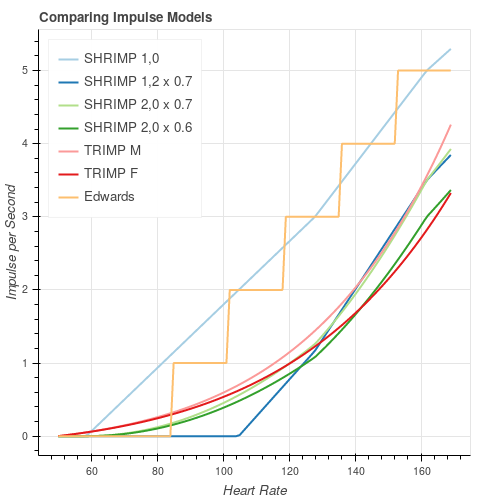
The figure above compares this model (SHRIMP gamma, zero) with
curves from Edwards and Banister (TRIMP M/F) (see Survey).
Since the different Impulse models depend on heart rate parameters
(rest, max, FTHR) in different ways I used my own values. The SHRIMP
data have been scaled to enable easy comparison (remember that overall
scaling is arbitrary).
A SHRIMP curve with gamma of 1 and zero of 0 is a reasonable
match to Edwards (except that it is continuous rather than stepped).
A SHRIMP curve with gamma of 2 and zero of 0 is a reasonable match
to TRIMP / Banister (both male and female, depending on scale).
A SHRIMP curve with gamma of 1 and zero of 2 is also a reasonable
match to TRIMP at higher values.
So SHRIMP can replicate existing Impulse models. Not perfectly, but within reasonable limits.
Response Calculation
The response is calculated by adding each impulse and decaying with the appropriate time constant as time increases. In addition, an arbitrary scale factor can be applied.
By default, the time-scale (tau_days) is taken as 7 for Fatigue and
42 for Fitness (this matches the values used on Training Peaks). The
scale factor is 5 for Fatigue and 1 for Fitness (chosen arbitrarily
so that Fatigue rises faster that Fitness and the two values cover
similar ranges).
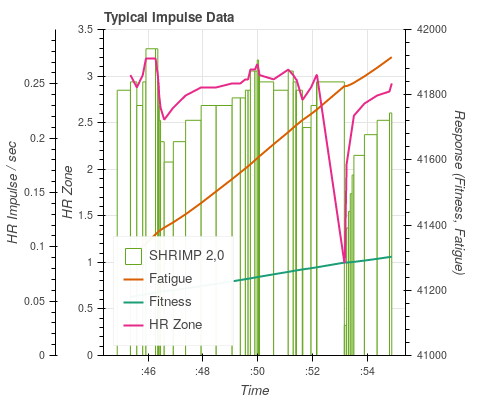
In the figure Impulses are represented by area (so the y axis is Impulse / duration). It is just possible to make out the increments in the Fatigue and Fitness responses as they sum the Impulse data. Fatigue is, as expected, increasing more quickly than the Fitness (but will also decay more quickly once the exercise stops).
Architecture
Choochoo was extended with three new pipeline classes:
-
HeartRateStatistics- responsible for calculating the HR Impulse. -
ImpulseStatistics- responsible for calculating the Fitness and Fatigue responses. -
ImpulseDiary- responsible for displaying the responses in the diary.
Pipeline tasks are Choochoo’s extension mechanism for calculating new statistics. They integrate with internal book-keeping to re-calculate values when new data are available, or old data are modified.
These can be configured in various ways. For example, by adding
additional instances of HeartRateStatistics to the statistics
pipeline we can calculate different HR Impulse (with different gamma
and zero parameters).
Similarly, we can configure additional responses.
The tasks are modified with “constants” - parameters that Choochoo users can modify from the command line. These allow, for example, the exponential decay time periods and the scaling factors in the models to be modified.
Choochoo manages activities by “activity group” (eg running, cycling). The statistics above are calculated for particular groups. We can have different parameters for different activities.
Results
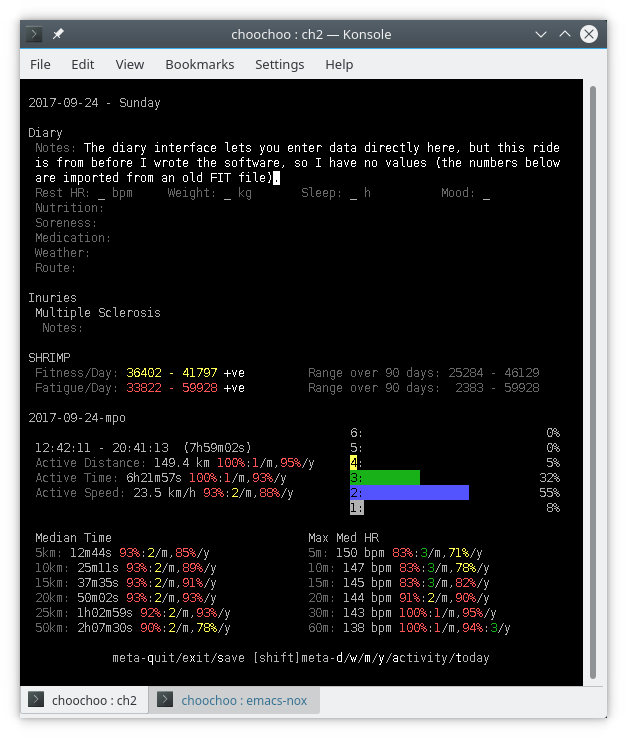
The screenshot above shows the SHRIMP data within Choochoo’s diary (mid-screen). The Fitness and Fatigue values are color-coded by quintile over the last 90 days (using a scheme that’s consistent across the interface), along with a small marker indicating with the daily change is positive or negative.
A similar display summarizes monthly and yearly variations.
You can see that fitness is increasing but also, in this case, that fatigue is higher than it’s been for the last 3 months.
Fitness and Fatigue values are managed by Choochoo in the same way as any other statistic. This means that they can be exported to Pandas DataFrames and analyzed in Jupyter notebooks.
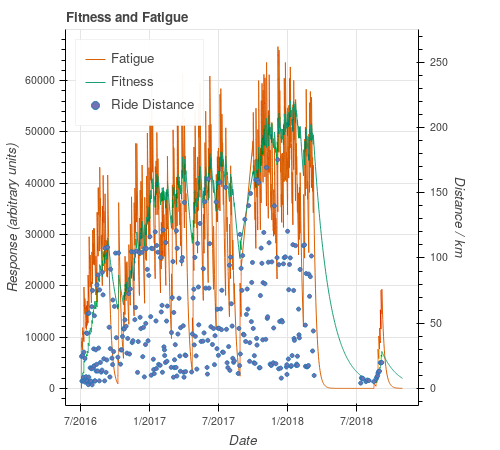
This plot (from this notebook) shows all my available data (from when I first bought a Garmin watch), illustrating the decline in fitness when I stopped riding after a serious accident. Both responses respond to exercise (shown roughly by the ride distance and frequency) as expected. Fatigue is “more noisy”, as expected.
Discussion
I hope reading this has helped you understand FF-Models. I hope it’s also given you some idea of what Choochoo can do.
Flexible Impulse
The gamma and zero parameters allows SHRIMP to match existing
calculations. It would be useful if the “correct” value of these
parameters could be found experimentally.
Training and Measurement
Experimental bounds on model parameters require reliable, repeatable, evolving measurements of Fitness.
Over the last few years I used a local climb (on a private road with no cars) to measure my performance. The data are poorly sampled and perhaps inaccurate, but it’s interesting to compare them to the fitness model.
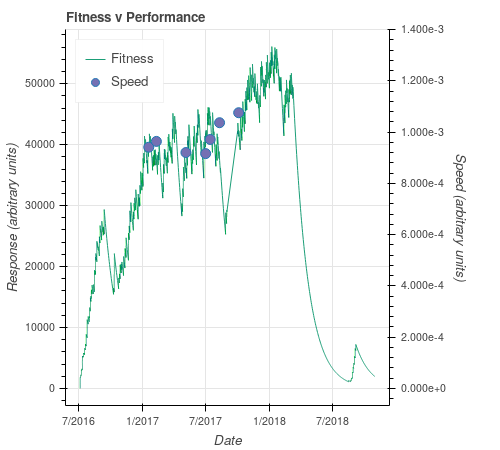
In the diagram, “Speed” is simply 1 / time in seconds. There may be a correlation between the points and the curve.
Going forwards - once I can ride again - it’s clear that regular performance measurements will need to be part of my training. Without them I have no hope of fitting model parameters.
Multiple Models
The architecture allows multiple models to co-exist in the database. This could be useful when comparing different parameters - perhaps during model exploration, or when comparing different values from the literature.
Heart Rate v Power
Discussion of Heart Rate v Power is usually polarized (at least in cycling communities). Most people appear to believe that power is universally “better” than heart rate.
Personally, I think both have their advantages. I suspect heart rate is dismissed partly because it’s less expensive. People seem to confuse “expensive” with “good”.
Measuring power has two clear advantages over heart rate:
-
Fast response. If you increase effort the numbers respond immediately. In contrast, heart rate takes time to increase. This is called “lag”.
-
Simple, direct interpretation. It’s meaningful to compare power output between two people. Or to compare power output for the same person from two different times. The value has a clear relation to the ability to win races. In contrast, interpreting heart rate is much more complex.
However, heart rate also has a possible advantage:
-
It is a more direct measure of the physiological load. Laying down 300W may almost kill you, while leaving Peter Sagan unruffled - that effort on your part will be clear in the heart rate data.
This is something of a philosophical point. What, exactly are we trying to measure? Fitness is nebulous; Fatigue is perhaps easier to intuitively understand. So what causes Fatigue? It’s not, exactly, power output. It’s something “within” the body. Some “use” of the body, as system. What most accurately measures that something? The output power? What about if we are ill in some way? If the body is not functioning so well? Then it will be stressed more for the same power output. That stress, it seems to me, will still be visible in the Heart Rate.
But I don’t think there’s an obviously correct answer here. Arguments I’ve read for power being the obviously correct answer seem to be confusing the question of Fitness / Fatigue with other uses of power meters. Uses like comparing athletes, for example, where power is clearly more objective.
In short, since our model is based on the idea that physiological load is what makes you fitter, it’s not unreasonable that heart rate provides useful insights.
Uncertain Science
I think I’ve already explained that I am not an expert in Sports Science. However, I do have some experience modeling and analyzing numerical data. And as I’ve explored this topic I’ve noticed some issues:
-
Very little of the literature is publicly available (for free). This is a general problem with all science.
-
The studies I could find are small. Obviously it’s hard to work with large numbers of athletes, but this means that any results are somewhat unreliable.
-
The studies don’t seem to be reproduced. Again, this is understandable - it’s a small field - but, again, it means the results are somewhat unreliable. “Ancient” conclusions are repeated, again and again. Until they appear set in stone.
On the other hand, as argued in the Training Peaks documentation (above) studies from different sports apparently do support each other (well, with qualifications).
-
Some emphasis seems, at best, misplaced. At worst it feels like obfuscation. The entire framework is arbitrary, yet people focus on small details (like adjusting Impulse scaling to reflect lactate levels). Wouldn’t it be better to use a simple parametric model (like SHRIMP’s
gamma) and then fit for the results?In the “damned if you do, damned if you don’t” camp, the Training Peaks documentation is laudably detailed, but so dense it makes the modeling seem like rocket science.
-
The people developing and promoting these metrics often appear to have financial motivation.
Here is an example. It’s an email from the scientist responsible for TSS. He’s using a single, cherry-picked example to argue that (power-meter based) TSS is significantly better than (heart-rate based) TRIMP. To promote software that he seems to gain from.
And Friel appears to be connected with Training Peaks.
On the other hand, what’s wrong with earning a living from the science you work on? I understand these are complicated issues.
Future Work
The obvious next step is to try fitting parameters. To do that I need to get back on the bike. Hopefully early next year. Starting with zero fitness will at least make it easier to measure change.
Appendix - The Author
I’m adding this because I don’t want to mislead. I’m no expert on this stuff. The details above come from papers I’ve found on-line. I could have misunderstood. Check things out for yourself. I’ve collected some of the papers here.
If you came here actually expecting to find something out about me, well… way, way back in the day I got a PhD in Astronomy, but most of my working life has been spent programming computers. I also like to ride my bike, when I’m not injured.
Appendix - An Alternative View
The description above presents fitness (or fatigue) as the “sum” of previous efforts. There is a decay component, for sure, but the fundamental idea is that you keep training and it “all adds up”.
That’s a little misleading.
An equivalent way of looking at the maths is that fitness is a running average of your most recent efforts. So if you trained hard in the last month (or so) then your fitness is high. If you didn’t, it’s low.
That’s also a perfectly valid way of looking at things. Yet the two views seem to contradict each other. If fitness is the cumulative result of a long period of training and steady improvement, how can it be calculated from only the last month of training?
But you cannot do a month of hard training if you have not already put in the hard work previously!
Another way to see this is to understand training as the following process:
-
You put in the hours, slowly getting better
-
As you improve, you can do harder workouts
-
Harder workouts give you a better fitness score
So even though we calculate fitness as a relatively short-term average, it reflects many months of cumulative effort.
The motivation for adding this comment came from fitting peformance data to find the time scale for fitness decay. I foud that the results were insensitive to my initial fitness (before i began recording data). This was because any initial value becomes irrelevant after a short period (some small multiple of the decay time).